In our increasingly interconnected homes, IoT (Internet of Things) devices generate a wealth of data. The efficient management and visualization of these data are often underestimated. Visualization can unveil usage improvements, upcoming errors or detect leaks, that might otherwise remain unnoticed.
This blog post focuses on the field of seamless logging and visualization of MQTT (Message Queuing Telemetry Transport) data – Learn how to harness the power of InfluxDB for efficient data logging, enabling both real-time and archived data visualization with Grafana. Discover the key steps to streamline the process and gain valuable insights into your connected home. Embrace the future of smart living with this comprehensive guide, ensuring you retain control over your IoT data flow using MQTT, InfluxDB, and Grafana.
Explore the myriad possibilities our integrated example setup provides for monitoring and gaining insights from your MQTT data. Dive into Grafana to visualize, analyze, and make informed decisions based on the rich data collected from your connected devices.
Getting Started
In our repository, discover a pre-configured Docker Compose file ready to establish an MQTT broker and InfluxDB data logger.
This basic setup offers an accessible entry point into maximizing MQTT, InfluxDB, and Grafana for comprehensive data management in which the MQTT broker logs all incoming data, directing it to the InfluxDB database (captured data is in the format /System/Parameter(Value)).
Note: For simplicity reasons, the MQTT broker operates in the initial setup without credentials!
However, it’s crucial to acknowledge that this could pose a potential security vulnerability. It is strongly recommended to implement robust authentication methods immediately after setup promptly.
Here you can find detailed guidance on implementing security measures.
In case you have any questions about the MQTT broker setup, do not hesitate to drop us a message. We’ll gladly provide detailed assistance.
Description of the individual services
- Mosquitto: Mosquitto is a lightweight MQTT broker facilitating communication between devices in IoT systems. In this setup, Mosquitto manages the MQTT protocol, ensuring secure and efficient message exchange between devices. The Dockerized Mosquitto instance simplifies deployment, making it easy to integrate into IoT architectures for seamless communication.
- Grafana: Grafana is an open-source platform designed for creating, exploring, and sharing interactive dashboards and visualizations. In this configuration, Grafana connects to InfluxDB to fetch and display time-series data. With a user-friendly interface and support for various data sources, Grafana empowers users to build insightful dashboards, facilitating the visualization of trends and patterns.
- InfluxDB: InfluxDB is a robust time-series database optimized for efficiently storing and querying data points over time. In this setup, InfluxDB acts as the backend storage for time-series data generated by diverse devices or applications. It ensures high-performance data storage and retrieval, making it an ideal choice for IoT, monitoring, and analytics.
- MQTT Bridge: The MQTT Bridge is a custom-built service connecting MQTT and InfluxDB. It functions as a bridge, receiving messages from MQTT topics and forwarding them to InfluxDB for storage. This containerized bridge ensures a smooth data flow between the MQTT broker and InfluxDB, allowing users to leverage the strengths of both protocols.
- Watchtower: Watchtower is a Docker container auto-updater that ensures all containers stay up-to-date with the latest versions. In this configuration, Watchtower monitors containers such as InfluxDB, Grafana, Mosquitto, and MQTT Bridge, automatically pulling and restarting them when updates are available. This automated process helps maintain the security and reliability of the entire system.
Why Grafana with InfluxDB: Grafana enhances the visualization experience when paired with InfluxDB. While InfluxDB efficiently stores time-series data, Grafana provides a flexible and feature-rich environment for creating dynamic and interactive dashboards. Grafana’s compatibility with various data sources, including InfluxDB, makes it an invaluable tool for gaining insights and monitoring trends in time-series data.
Setup
These commands set up the MQTT-InfluxDB-Grafana-Insights environment using Docker containers.
- Downloads the necessary files from the specified Git repository.
git clone https://gitlab.com/flogusch/mqtt-influxdb-grafana-insights.git - Changes the working directory to the newly cloned directory to perform further actions.
cd mqtt-influxdb-grafana-insights/ - Starts the Docker containers based on the configuration defined in the
docker-compose.ymlfile.
The-dflag stands for “detach,” meaning the containers are started in the background.docker-compose up -d
After executing these commands, the containers should be started, and the services (InfluxDB, Grafana, Mosquitto, MQTT Bridge) should be deployed according to the specified configuration.
Hint: use docker ps for an overview of running docker containers.
MQTT Explorer
- Download MQTT Explorer:
Download MQTT Explorer from http://mqtt-explorer.com/ and install the application on your local device. - Open the Application:
Launch MQTT Explorer after installation. - Connect to the Local Broker:
Click the “Plus” symbol or “Connect” in the top toolbar.
Fill in the connection details:- Hostname: localhost (or the IP address of your broker)
- Port: 1883 (standard MQTT port)
- Client ID: (optional, can be left empty)
- Click “Connect.”

Publish a Topic:
- Click on the “Publish” tab on the right side.
- Enter the topic “TestSystem/Powermeter.” – This is for test purposes only
- Enter the value “1000” in the corresponding field.
- Click “Publish.”
Grafana Setup & Dashboard Creation
- Launch Grafana:
Start the Grafana service. The default address is usuallyhttp://localhost:3000(or the IP address of your Grafana Server). Access the Grafana web interface through your browser. - Login to Grafana:
Use the default credentials (admin/admin) to log in for the first time. Change the password when prompted. - Add InfluxDB Data Source:
In Grafana, go to “Settings” (gear icon on the left sidebar) and click on “Connections” then “Data Sources.”
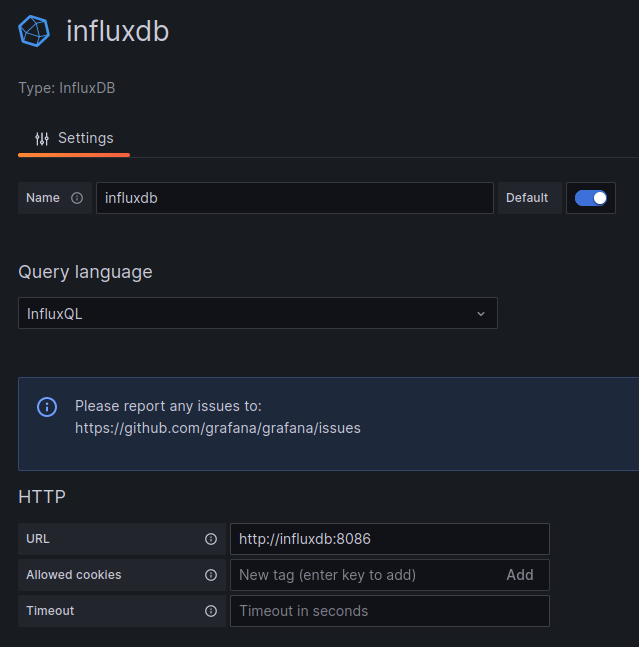
Add a new data source and select “InfluxDB” from the list.
Configure the connection details (HTTP URL, database, etc.) for your InfluxDB instance.
To save it Click on “Save & test”.

- Create a Dashboard:
In the Grafana sidebar, click the “+” icon and select “Dashboard.”
Click on “Add visualization” to start building your dashboard. - Configure Panel Settings:
Choose the data source you added (InfluxDB) for your panel.
Define the query to retrieve data from InfluxDB. For example, select the measurement and field for your MQTT data.

- Visualize Data:
Choose the visualization type (graph, table, single stat, etc.) for your panel.
Fine-tune the settings, such as axis labels, colors, and legend options.
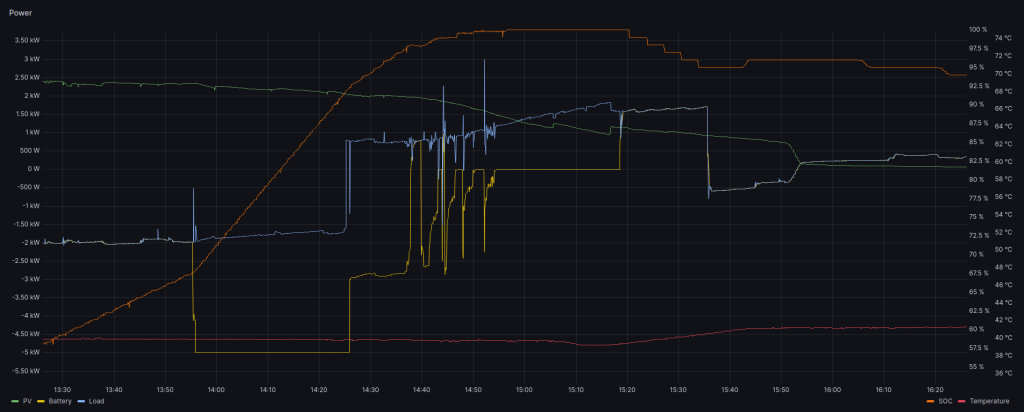
Example Grafana Dashboard